
Why we invest in a lot of companies
(and built a tool so you can see the math)

A few years ago I was having coffee with an LP who wanted to understand what we did differently. He ran a family office and had looked at plenty of seed funds. Midway through the second cup, he asked the question every LP eventually asks a concentrated-conviction GP. “How many companies are you going to invest in?”
I said 150 over the fund’s three-year deployment window.
He paused, then, polite but pointed, said the thing I have now heard dozens of times. “Isn’t that spray and pray?”
That conversation is why this piece exists. And it is why we spent the last few weeks building an interactive tool that lets anyone test the math themselves. The tool is free. You can open it on your phone (although it is better to use on desktop), drag a slider, and see the argument we have been making to LPs for the last three funds, play out in real time.
Here is the argument in one sentence. Venture outcomes follow an extreme power law, and power laws reward more at-bats with better-quality returns, not fewer at-bats with bigger bets.
That is not a slogan. It is a consequence of how the returns distribute. The shape of the distribution is not a matter of opinion. It comes from the largest publicly available dataset of venture outcomes (Correlation Ventures, 21,000 financings), from Horsley Bridge’s empirical analysis of what separates top-tier VC funds from the rest, and from the Kelly criterion, which is the math gamblers and quantitative investors use to decide how much to bet when the odds are asymmetric. Three independent frames. They all point in the same direction.
Let me show you what the math looks like. Then I will explain why more companies produces more value per dollar, not less.
The quality of returns lifts with volume
Imagine you are running a seed fund with industry-average luck. Fifty-five percent of your companies go to zero. Fifteen percent give you your money back. Another fifteen percent produce a modest 3x. Eight percent hit a solid 10x. Two percent are unicorns, half a percent become decacorns, and one in a thousand becomes something like Stripe or OpenAI, which is a 5,000x (or a lot more) outcome.
Most seed funds hold around 30 companies. At that size, with reserves deployed sensibly into the winners, the math says about 21 percent of funds clear a 5x return. The median outcome is a 2.8x gross MOIC. After fees, that is a fund most LPs would politely call “fine.”
Now invest in 150 companies with the same luck and the same per-company budget.
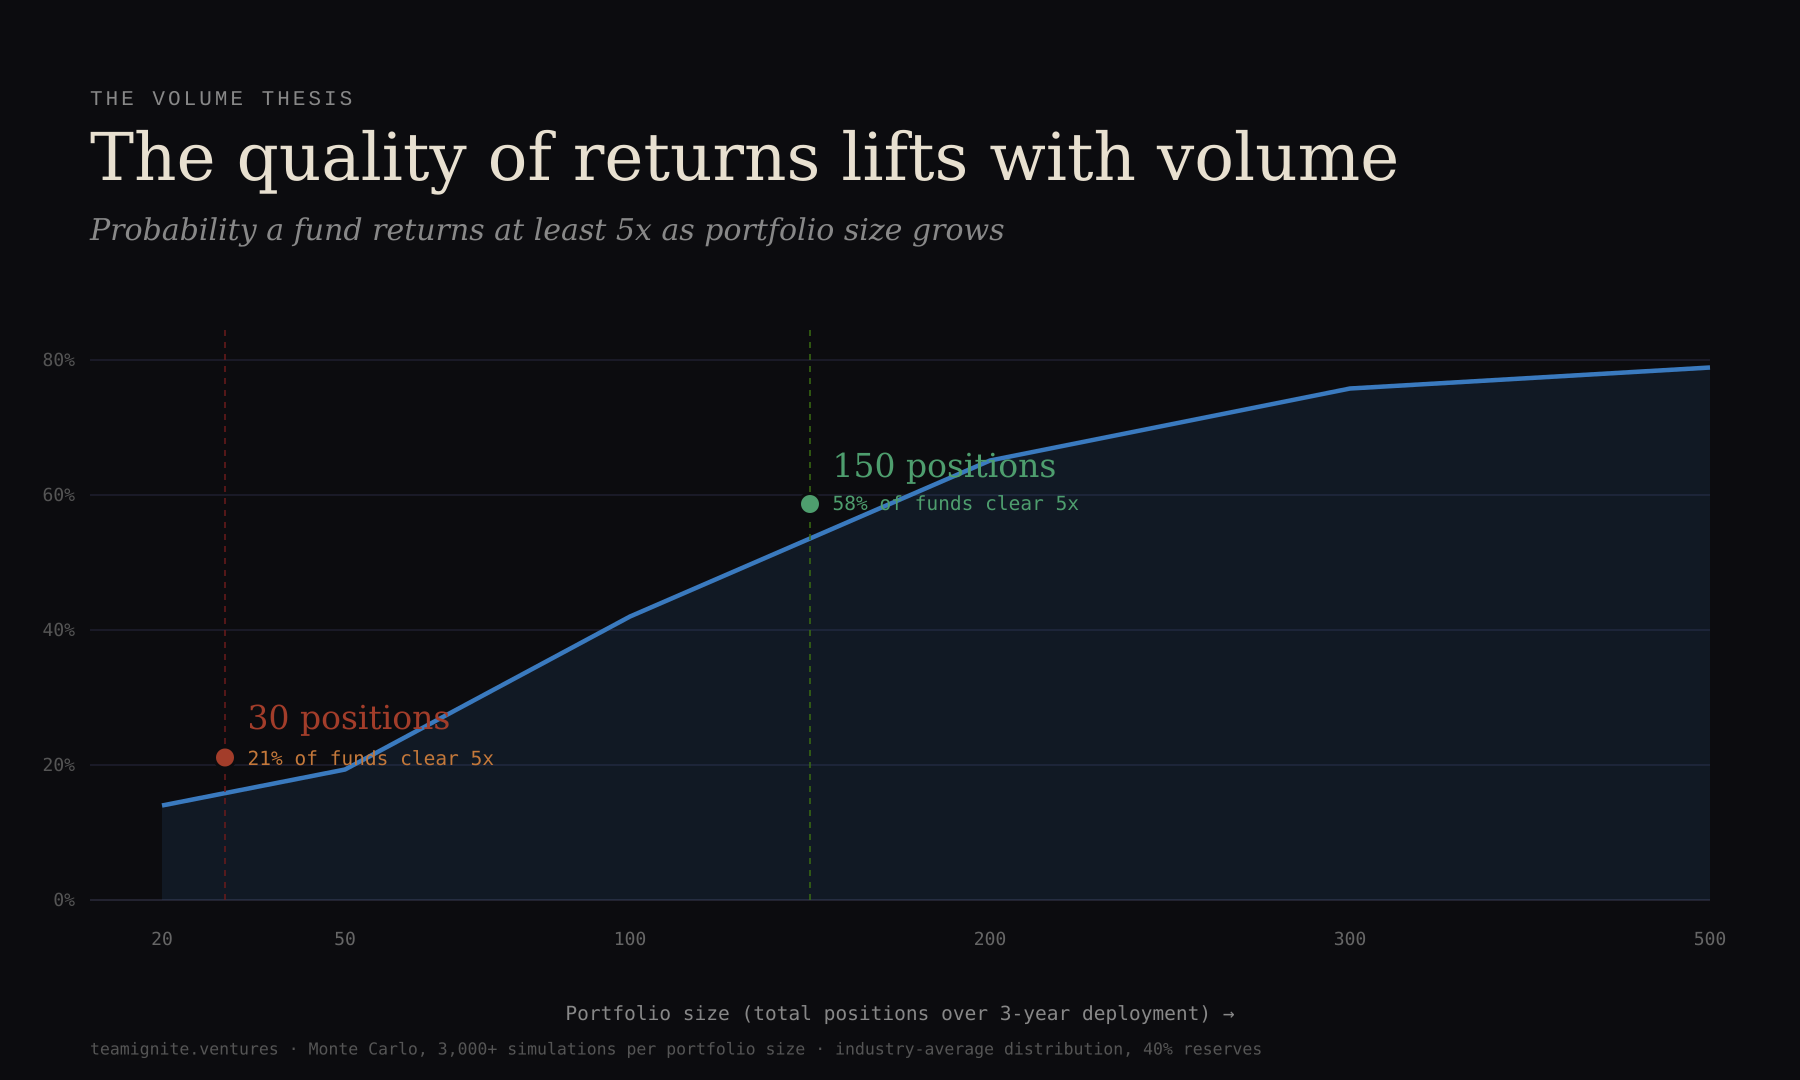
The probability of clearing 5x climbs from 21 percent to 58 percent. Median MOIC nearly doubles, from 2.80x to 5.55x. The range of likely fund outcomes also tightens dramatically. A 30-position fund can land almost anywhere, from near-zero to a home run, and most LPs have no way to know in advance which version they’re getting. A 150-position fund still contains the same unicorns and decacorns, but individual funds cluster much more tightly around their average return. You lose the extreme downside and a little bit of the extreme upside, and you gain the thing LPs actually want from a portfolio: a return profile they can plan around.
Nothing in the outcome distribution changed. We did not improve at picking. We did not forecast winners. The quality of returns got better because we took more shots at a distribution where almost all the value lives in the tail. At 30 positions, you need to catch a unicorn to look good. At 150, you probably catch one or two unicorns just from the math, and the fund’s upside is less dependent on getting any single bet right.
The intuition is the one every poker player already has. If one suit in the deck pays a million and everything else pays nothing, and the dealer is about to turn over cards, you would rather see more of the deck. The concentrated fund is making a smaller number of draws from a distribution where the payoff is wildly asymmetric. Sometimes it works. More often, the unicorn doesn’t show up in those 30 cards.
Same math, two strategies
The chart below is the inside of the tool. The two panels show 30 positions and 150 positions running against the same simulated outcome distribution with the same random seed, so the draws are mathematically identical. The only thing that differs is how many positions the fund owns.
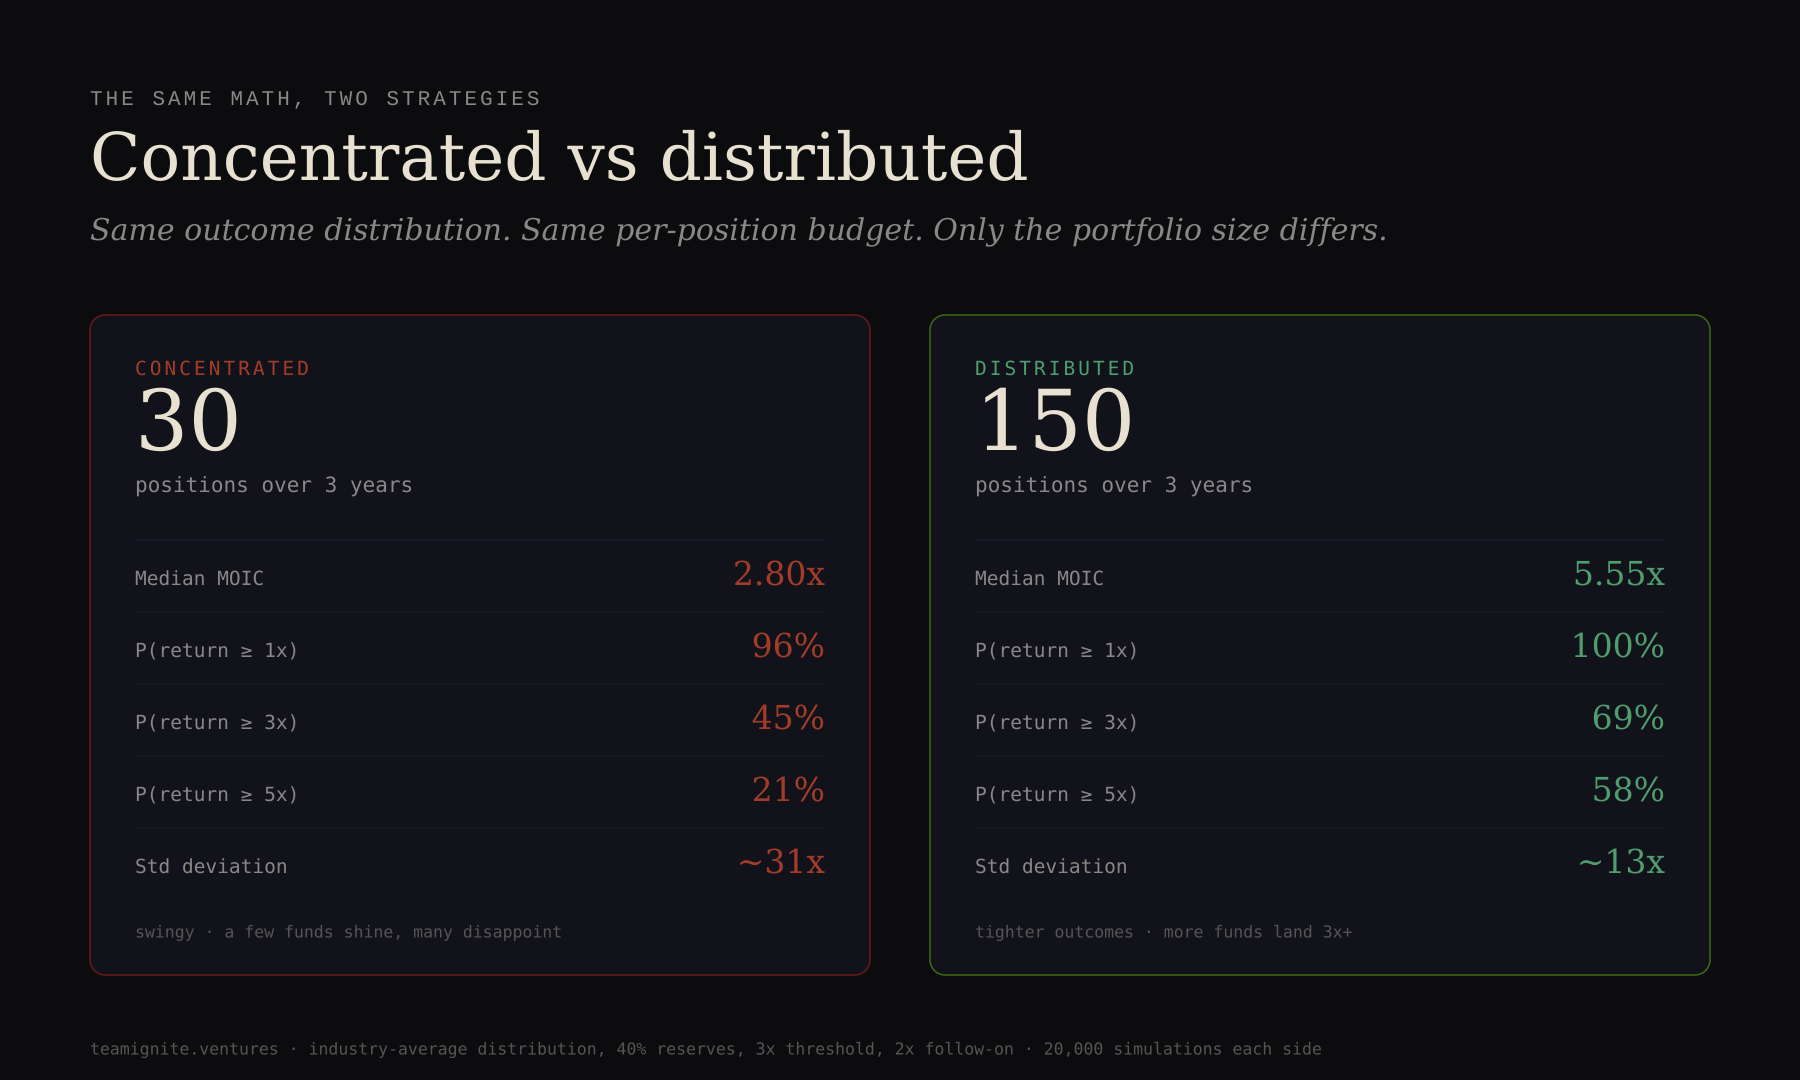
Read the numbers in pairs. The concentrated side has higher variance, which is the technical way of saying the distribution of possible fund outcomes is wide. Sometimes a 30-position fund catches a unicorn and looks like a genius. More often it doesn’t, and the whole fund underperforms. The distributed side compresses that variance. Fewer funds land in the tails at all, and more of them land somewhere the LP can live with. The probability of a 3x fund rises from 45 percent to 69 percent. The probability of a 5x fund nearly triples.
If you are thinking “the concentrated fund’s upside is still real, so maybe it’s worth the variance,” that is the honest version of the counter-argument. A concentrated fund in 1999 that caught Google returned every dollar you put in several hundred times over. The trouble is that you are not the person who caught Google, and you don’t know who is. The 30-position fund that doesn’t catch Google is the typical outcome, not the exceptional one. For an average GP picking 30 companies, the distribution of fund outcomes is dominated by the versions where the unicorn never comes.
Why this isn’t obvious
If the math is this clear, the reasonable question is why every LP isn’t already buying it. The answer is that they already are. They just take it through more expensive wrappers.
A $500 million commitment to a fund of funds lands in 20 to 40 underlying managers, each of whom is running a portfolio of 30 to 80 companies. The endowment, pension, or sovereign writing that check ends up with effective exposure across 800 to 3,000 startups. Mega funds like Sequoia Capital Global Growth and Tiger Global hold hundreds of positions across their strategies for the same reason. The biggest pools of institutional capital have already decided, with their allocations, that venture exposure wants to be held at hundreds or thousands of underlying positions. That is a settled practice at scale.
What is newer is that a single fund with the right deal flow can produce position counts that rival a fund of funds, without the double layer of fees. That requires being able to see, evaluate, and invest in enough high-quality companies per year to make the math work. Which brings us to the part that took us five years to build.
The binding constraint
Here is what the simulator cannot show you. A 150-position portfolio requires access to 150 investable companies in a three-year window. Most seed funds can’t reach that threshold at quality. Their deal flow runs out. Most concentrated funds are not concentrated by choice. They are concentrated by necessity.
We are not. Y Combinator produces roughly 800 pre-vetted companies per year across four batches. That is the raw input. But raw input isn’t enough on its own. You also need the relationships to get in at the terms you want, the intelligence to tell the signal from the noise, and the operating muscle to support 150 founders without becoming the investor who doesn’t pick up the phone. Volume without the rest of the stack is the spray and pray caricature. Volume with the stack is something else entirely.
The stack is where this gets interesting, and it is the part that compounds.
Every investment we make adds to the network. Every founder who works with us can become a scout, a reference, a customer for another portfolio company, or a future LP. Every VC we co-invest with becomes a co-invest partner for the next deal. Every conversation on the Ignite Podcast becomes a relationship with a founder, VC, or operator who now knows us. Every blog post brings in another intelligent reader who wants to understand private markets better.
Said out loud, that sounds like marketing. On the ground it is a set of very specific loops. More companies means more referrals. More referrals means better deal flow. Better deal flow means better companies invested in. Better companies means better outcomes. Better outcomes means more founders want to work with you. More founders want to work with you means more referrals. Run that loop for half a decade and the deal flow problem that constrains most seed funds stops being the binding constraint.
The same loop runs through the other sides of the business. More than three thousand VC relationships means we can route a founder toward the right Series A lead in the right week. Fifteen thousand community members and counting means when a founder needs ten customer conversations, they get ten. Half a million monthly viewers across social means a portfolio company launch moves when we push it. None of this is free. But the marginal cost of adding one more position, given that the network is already in place, is almost nothing. And the marginal value of that position, both for the company and the network, is real.
That is how volume becomes a strategy instead of a prayer.
The honest caveats
If I only tell you the good part, I have failed you. The math has real limitations and it is worth being explicit about them.
First, the simulation assumes the outcome distribution holds across all 150 positions. In reality, if you invest in every YC batch without discrimination, you are also catching the bottom of the batch. Selection still matters. The simulator has a skill slider that adjusts for this, and at every level of skill the volume argument still holds, but the magnitudes change. A below-average picker investing in 150 companies still does meaningfully better than the same picker investing in 30. A great picker investing in 150 does materially better than a great picker investing in 30. Skill and volume compound.
Second, the follow-on math in the tool assumes threshold-based reserve deployment rather than conviction-based. Real GPs make judgment calls on which winners deserve more capital. The simulator handles this by scaling follow-on outcomes with the skill parameter, but the abstraction is imperfect. This is one of the places I genuinely want feedback. If you have seen reserve deployment fail for a reason the model doesn’t capture, tell me.
Third, the three frameworks in the tool (Horsley Bridge, Kelly, and Monte Carlo) are not independent. They share distributional inputs. Change the assumption about how often a unicorn appears and all three move together. The tool’s Overview tab shows an expected-value breakdown that makes this explicit. Look at it. The rare outcomes do most of the work. If you disagree with the rare-outcome probabilities, your disagreement moves the whole result. The tool lets you edit the distribution yourself.
Fourth, and most importantly, this is our strategy. It is not a universal prescription. A great investor running Benchmark-style conviction at 10 positions can beat us if their picking is good enough and their access is deep enough. Historical concentrated funds that worked produced extraordinary returns. The math in this tool is the defense of our particular approach, not a claim that everyone else is wrong.
Fifth, this is version one. The numbers in this piece come from a specific set of defaults. If you change the defaults, you get different numbers. Some of those differences will challenge my framing. Good. That is the point.
Try it yourself
The tool is free and takes no login. You can move a slider from 30 to 500 positions and watch what happens. You can flip between the industry-average distribution and the YC-historical distribution, which has a higher hit rate and tighter outcomes. You can edit the underlying probabilities if you think our assumptions are too generous or too conservative. You can change the skill parameter. You can compare concentrated and distributed strategies head to head with the same random seed so the comparison is fair.
If you are an LP thinking about venture allocation, I would particularly encourage you to play with the head-to-head tab. Pick a GP pitch you have heard recently, estimate the position count they are running, and see what the math says the distribution of outcomes looks like for their strategy versus ours. You do not have to believe our numbers. Edit them until you believe them. The shape of the answer will probably surprise you.
This is version one. We shipped it fast so we could get feedback early. If something is confusing, wrong, or missing, please say so. I read every response.
We run this strategy because we believe the math. We built the tool because we think most LPs deserve to see the math for themselves, without having to take any GP’s word for it, including ours. Venture capital has too many people telling you what to believe and not enough people showing you why.
Here is the math. Here is the code. Run it. Push back. If you come to a different conclusion, I want to hear what it is.
If you want to go deeper on what we do, our value proposition for LPs lays out the wider platform, from quarterly top-ten watch lists to the operator network we deploy on behalf of portfolio companies. If you want to see the companies we have backed, check out our portfolio here. If you want to listen to founders and fund managers describe how all of this plays out in practice, the Ignite Podcast is nearly three hundred-plus episodes deep at this point.
More than anything, the best thing you can do is open the tool and spend five minutes with it. The numbers make the argument better than I can.
Try it here: https://tools.teamignite.ventures/
Sources and further reading
The probability distributions in the tool are calibrated from published research. Every claim in the piece and the simulator footer maps to one of these:
Outcome distributions
Correlation Ventures’ 21,000-financings study (covering 2004-2013), originally published by Seth Levine at sethlevine.com, with a 2019 update here. The source of the “65% of financings return below 1x” and “4% return 10x or more” figures.
Carta’s Class of 2018 cohort data on seed-funded startup outcomes, summarized by SaaStr here. The source of the “30-35% of seed-funded startups shut down within 7 years” and “1.3% become unicorns” figures.
Outlier rates by fund tier
Horsley Bridge outlier-rate data via Ulu Ventures, at uluventures.com/picking-winners-is-a-myth and their longer Portfolio Construction essay. The source of the “top-tier VC 4.5% outlier rate” and “average VC 2% outlier rate” figures. Cambridge Associates’ 2.5% industry average is cited inside both of these pieces.
The “hypothetical superstar” tier in the tool (7% outlier rate) is Ulu Ventures’ construct representing “50% better than top-tier,” used to stress-test concentrated-portfolio claims. It is not an empirical observation and is labeled as such in the tool.
YC-specific numbers
YC unicorn rate, Garry Tan on X, August 2025: x.com/garrytan/status/1953069914132238775. Tan’s stated range is 6% to 12% for the last ten years of batches. Our default of 6% sits at the low end.
PitchBook’s 2023 analysis of YC cohorts, via Yahoo Finance. The source of the “4.5% of YC startups since 2010 become unicorns, 5.4% for 2010-2015 cohorts” figures.
YC batch size, via Hustle Commons’ profile of Garry Tan. The source of “400+ per batch, two batches per year, ~800 per year.”
Fund economics
J-curve pacing for seed-vintage funds: Moonfare’s overview and Pipeline Road’s benchmarks.
2-and-20 (2% annual management fee, 20% carry on profits above 1x) is an industry convention, not a single-source citation.
Team Ignite platform
Our value proposition for LPs, which describes the platform beyond the investment thesis.
The Fund III deck, with the portfolio and independent TVPI benchmarks.
The Ignite Podcast, now past 250 episodes.
FAQ: the pushback I have already gotten
Before I published this piece I sent it to a friend who runs another VC firm and has a computational CS background. He was skeptical. Specifically, he pushed back on the math. He pushed back hard on every assumption in the simulator, and some of his pushback was right. What follows is a set of questions that came up in that conversation and in early LP reviews, with honest answers rather than defensive ones.
Aren’t you treating each investment as independent when they clearly aren’t?
Yes. That is a real limitation of the model and it deserves a direct answer.
A Monte Carlo simulation assumes each draw is independent and identically distributed, meaning each company in the portfolio is treated as a fresh roll from the same distribution. In reality, the 150th investment in a fund can differ from the 1st. For a fund with a fixed deal pool and declining access, the 150th pick is worse than the 1st. For a fund like ours, drawing from YC and Speedrun batches that refresh every quarter with a consistent quality bar, the pool is replenished continuously. The 150th pick across a three-year deployment is drawn from a universe of roughly 2,400 pre-filtered companies, not from the same batch with the best ones already taken. Whether the distribution degrades, stays flat, or improves with position count is a function of the specific fund’s sourcing model. The simulator assumes it stays flat, which is closer to our reality than the degrading-distribution case. Not to mention our deal flow leads to more deal flow.
The simulator is a thought experiment that says, “if position count were the only variable that changed, what would the math predict?” It’s useful for building intuition about why power-law distributions reward more at-bats. It is not a fund model. A real fund has correlated outcomes across sectors and vintages, a selection function that interacts with portfolio size, and network dynamics that evolve over time. The tool captures none of those.
What it does capture is directionally correct for a picker with stable deal flow: more positions produce better expected outcomes in a power-law world. What it cannot show is the exact tradeoff between position count and per-position quality, which is the question every real GP has to answer with judgment rather than math.
Isn’t a smaller portfolio better because it lets you focus on the best companies?
Only if you can reliably tell which companies will be the best in advance. The research on selection says most GPs cannot.
Consider the arithmetic. A 20-position fund investing out of a YC batch of 200 is making an implicit bet that its 20 picks will include the batch’s outliers. If its selection is no better than random, the expected number of outliers captured is one-tenth of the batch’s total outliers. A 150-position fund investing out of the same batch captures three-quarters of whatever outliers that batch produces, regardless of picking ability. For the concentrated fund’s smaller portfolio to be the better choice, the GP has to be confident their picking meaningfully beats the batch’s own filter, which is already one of the most selective in venture (roughly a 1% acceptance rate).
That is a higher bar than most GPs can clear. Including, to be clear, us. We do not claim to out-pick the YC admissions process. We claim to run a disciplined investment framework on top of an already-selected population, and to capture more of that population’s tail than a concentrated fund can. The concentration bet and the volume bet make different assumptions about selection ability. Volume is the honest choice for a GP who does not believe they have a reliable crystal ball.
Where does your outcome distribution come from, and why do you assume it applies to every position in a 150-company portfolio?
The distributions come from published datasets: Correlation Ventures’ 21,000-financings study, Horsley Bridge’s published outlier rates, Cambridge Associates’ industry averages, and Carta’s Class of 2018 cohort data. Sources are cited in the piece and in the tool footer.
The fair critique is that those distributions are averages across the whole venture industry, and no single fund’s outcomes match the industry average. A top-tier fund has a better distribution. A bottom-tier fund has a worse one. Applying a single distribution uniformly to all 150 positions assumes you can hold quality constant as you scale, which is a defensible assumption for some sourcing models and not others.
That’s why the tool has a skill slider. Move it up and the distribution shifts toward better outcomes. Move it down and it shifts the other way. The volume argument holds at every skill level, but the magnitudes change. A below-average picker still does better with 150 positions than with 30. A top-tier picker does even better with 150 than with 30. Skill and volume compound. Neither replaces the other.
What the tool doesn’t do in v1, and what I’m adding to v2, is let users configure how the distribution changes across position count. The current assumption of “stays flat” is our view for a YC-focused fund with a compounding network. Others will disagree, and the tool should let them test their own assumptions.
How can diversification reduce your risk if sector risk and vintage risk don’t go away?
It can’t. And it doesn’t.
Diversification across 150 positions reduces idiosyncratic risk, which is the risk tied to any specific company. It does nothing about systematic risk. If the entire AI category collapses, or interest rates wreck the IPO market, or a macro event shuts down exits for three years, a 150-position portfolio suffers the same way a 30-position portfolio does.
The claim in the piece is narrower than “diversification reduces risk.” The claim is that for the specific risk of a fund underperforming its target return because none of its companies became outliers, more positions reduce that specific risk. That is a real benefit. It is not a claim that all risks are reduced.
An LP considering this strategy still has to think about sector concentration within the 150 (we’re heavily AI and B2B SaaS, so that is real risk), vintage concentration (fund II and fund III are deploying into overlapping market conditions), and macro exposure (we can’t diversify away a 2008 or a 2022). The volume argument is specifically about power-law capture, not a general claim of risk reduction.
Standard deviation of fund outcomes isn’t observable the way it is in public markets. Isn’t the “spread tightens” claim fake?
Partially yes. And this is a good catch.
Public companies are marked to market every day, so standard deviation of returns is a measured quantity. Private companies are valued quarterly at best, usually lag the real value by a year or more, and only resolve to actual dollars on exit. So “standard deviation of fund MOIC” isn’t a number you can point at in reality. It’s a number that falls out of a simulation.
What the simulator shows is that within the model, simulated fund outcomes cluster more tightly as position count grows. That statement is mathematically true given the independence assumption. Whether it translates to real-world funds is a separate question.
The better way to read the tightening is as “distribution of simulated outcomes,” not “distribution of real fund outcomes.” Real funds have additional sources of variance the simulator doesn’t model. So the absolute number (13x standard deviation at 150 positions) is not a prediction for our actual fund. It’s a statement about what the math does when you hold everything else constant.
Doesn’t the efficient frontier say there’s no free lunch? How can you lower risk without lowering return?
You can’t, and the piece doesn’t claim you can.
Look at the head-to-head comparison carefully. The 150-position portfolio has a lower probability of extreme upside than the 30-position portfolio does. The concentrated fund has a wider distribution on both sides. Sometimes it produces a 20x outcome that the distributed fund might not reach, because the distributed fund is pulling the mean down by averaging across many positions.
What the distributed fund trades is the tail risk on both ends. It gives up some ceiling in exchange for a higher floor and a higher median. For an LP trying to plan a portfolio around a predictable target return, that trade is attractive. For an LP explicitly seeking maximum upside and willing to accept higher variance, it isn’t. The volume strategy is not Pareto-superior to concentration. It is optimized for a different objective function.
The efficient frontier still holds. We are picking a different point on it than a concentrated fund picks, and we think that point is the right one for most LPs. That is a judgment call, not a math proof.
If the math says more positions is better, why doesn’t the perfect investor just invest in everything?
They don’t, and that’s the right intuition pump to stress-test the model.
A perfect investor with oracle-level foresight would invest in 3 companies: the three centa-corns in the next decade. Their portfolio would return thousands of x. That’s the theoretical optimum, and a 150-position strategy would have trouble beating it.
The reason the volume strategy makes sense is that nobody has oracle-level foresight. Among real investors, the spectrum runs from “well above average” to “well below average,” and for the vast majority of the distribution, adding positions improves expected outcomes because the cost of missing a winner is higher than the cost of adding a loser.
The implication is not “volume is always right.” The implication is “volume is right unless you have genuine oracle-level insight, in which case concentrate.” We think most investors, including most professional GPs, are closer to average than oracle. We count ourselves in that group, not above it.
Peter Thiel says concentration wins. Aren’t you arguing against him?
Thiel made Facebook returns on a $500,000 check because he had genuine contrarian insight and the access to act on it. That worked. I’m not arguing it didn’t.
The argument is that Thiel’s strategy is right for Thiel and wrong for almost everyone else. The counterexample to his framing is the hundreds of concentrated-conviction funds that didn’t catch Facebook and underperformed as a result. We only remember the ones that got the home run. Survivorship bias makes concentrated strategies look better than they have performed in aggregate.
If you genuinely believe you are Peter Thiel, concentrate. If you believe you are a disciplined, well-networked, hard-working, thoughtful investor who is not literally Peter Thiel, the math says spread out a bit.
The tool compares the same distribution at different portfolio sizes. What happens if I change the distribution as I scale?
Fair question, and it’s the one I owe the most detailed answer to. The current v1 tool holds the outcome distribution constant as position count grows. That assumption is closer to our reality than to most funds’ reality, for reasons explained in the first answer. But reasonable people disagree about it, and the tool should let them test their own view.
A user could model distribution-degrading scale by splitting the portfolio into tiers. For example: positions 1-30 draw from the YC-calibrated distribution (6% unicorn rate), positions 31-90 draw from a slightly worse distribution (4%), positions 91-150 draw from a worse one still (2%). That would model a fund whose deal flow quality declines as it extends its reach.
I’m adding that configurability to v2 as a user-adjustable toggle. The user will be able to set whether the distribution improves, stays flat, or degrades with position count, and see how the result changes. Our own view, laid out in the companion piece on the network flywheel, is that for a YC-focused fund with an active network, the distribution stays flat or improves slightly over the deployment window. We think that because our sourcing draws from a continuously replenished batch system (~800 YC + ~200 Speedrun per year), because our network compounds with each portfolio addition, and because our selection tooling has gotten meaningfully better with scale, not worse. But I want the LP to test their own assumptions, not mine.
If you want to stress-test this in v1, the skill slider is the closest proxy. Drop the skill to below-average and see what portfolio size maximizes expected return. That’s a rough approximation of what happens when deal flow quality degrades.
What is this tool for, then?
It is a pedagogical tool, not a fund model. Its job is to show why power-law distributions make volume-based strategies mathematically coherent, not to predict the outcomes of our fund or anyone else’s.
If you are an LP trying to decide whether our strategy is defensible, the tool is useful. If you are trying to figure out whether we will specifically hit a 5x MOIC on fund III, the tool tells you nothing you can use. The real question for an LP is whether our deal flow, our selection, our network, and our operating stack are good enough to capture the volume strategy’s theoretical upside in practice. That is an empirical question about our fund, not a question the simulator can answer.
The reason to publish the tool anyway is that most LPs have never seen the underlying math laid out in a form they can poke at. The argument for a volume strategy is usually hand-waved with phrases like “more shots on goal” and “power law,” which is not persuasive. Showing the math, and explicitly flagging where it breaks down, gives LPs something to push back on. The conversations I’ve had since publishing it are better than the conversations I was having before. That was the goal.
So is the strategy defensible or not?
The strategy is defensible. The specific numbers in the simulator are directionally useful and depend on assumptions a reasonable LP might or might not share. Those are two different statements and both are true.
A fund running 150 positions with average deal flow and average selection will in expectation beat a fund running 30 positions with the same deal flow and selection. That claim holds up under every reasonable modification of the model I have tested, including versions that let the distribution degrade modestly with scale. What shifts with better modeling is the magnitude of the advantage and the optimal position count. What doesn’t shift is the direction.
If you think we have below-average deal flow and selection, the strategy still works but the numbers are worse. If you think we have above-average deal flow and selection, the strategy still works and the numbers are better. If you think you have top-tier deal flow and selection yourself, concentrate, and you disagree with your own assessment of your ability to tell the difference in advance.
The tool is one piece of evidence. The rest of the evidence is our track record, our network, our operating platform, and the specific portfolio companies we have backed. Any LP evaluating us should weigh the math alongside those, not instead of them.